The past five years have been a struggle for most of us. Moving from a global pandemic to various wars to natural calamities all over the world, adjusting to this current scenario has been a challenge. The same is the case in the job market with mass layoffs and hiring freezes. Gathering data from Kaggle, which can be found here, I decided to dive into the world of layoffs and visualize the data.
The purpose of this study is to analyze the data on tech company layoffs to identify trends and patterns. The study seeks to determine the factors that contribute to layoffs, such as a company's financial performance, and industry trends.
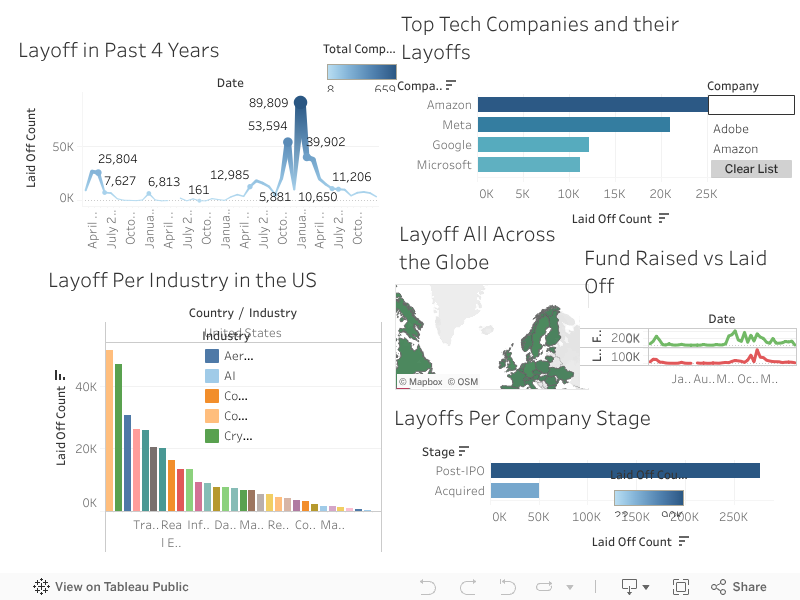
The image shows that the tech industry has experienced a significant number of layoffs in recent years.
Some of the hardest-hit companies include Amazon, Meta, Google, and Microsoft. The data also suggests that there
is a correlation between the amount of funds raised by a company and the number of layoffs it has had. This could
be because companies that raise a lot of money are more likely to be under pressure to grow quickly, which can lead
to overstaffing and layoffs when the economy slows down.
It is important to note that the data in this image is limited in scope and may not be representative of the entire
tech industry. Additionally, the causal relationships between the variables shown in the image are not clear. More
research is needed to determine the true causes of tech company layoffs.
Overall, this image provides a valuable snapshot of the various industries and the challenges it is facing. By
analyzing data on layoffs, we can gain insights into the health of the industry and identify potential risks for the future.